
Support Portal
Discover our Support Portal, your one-stop destination for accessing essential resources such as brochures, product datasheets, operation guides, and more.
Explore
Pilot Wireless Network

Small Cell

Drive Test/Outdoor Test

Indoor Test

Autonomous Measurement

Laboratory Automation

Post Processing

Drone-based Testing
Dingli's Pilot Wireless Network Solution is instrumental in ensuring seamless signal transmission between base stations and mobile devices. This cutting-edge solution is tailored to improve the performance, reliability, and efficiency of wireless networks, delivering enhanced network quality and user experience.
Read More Find the related productsSmall Cell Networks power the next wave of wireless innovation, delivering high-quality, reliable connectivity for demanding environments like smart enterprises and hospitals
Read More Find the related productsDingli's LTE drive test solutions give mobile operators real-world visibility into outdoor 4G and 5G performance, measuring coverage, signal quality, throughput, handover and service experience along defined test routes.
Read More Find the related productsIndoor cellular coverage tester solutions evaluate and optimize networks in malls, hospitals, offices, residences, schools, and underground parking lots.
Read More Find the related productsAutonomous Measurement uses advanced tools to monitor and validate network performance, streamlining evaluation and reducing manual effort.
Read More Find the related productsLab test solutions verify 4G/5G performance and reliability before deployment, ensuring every component meets the highest standards
Read More Find the related productsDingli provides cutting-edge Post Processing solutions and a powerful software platform for network analysis and benchmarking, maximizing performance and reliability.
Read More Find the related productsDingli Drone-Based Testing is an automated solution designed for the emerging low-altitude economy, enabling precise 5G vertical coverage analysis.
Read More Find the related products
Enables seamless smart applications, reliable connectivity, and enhanced driving safety

This cost-effective NB-IoT testing and eMTC testing solution includes essential measurements, signaling tests, failure alarms, and post-processing.

Measure QoS and QoE for all OTT applications and services

Accelerate digital transformation with 5G private network testing that improves reliability, efficiency and productivity.

Measures and analyzes network performance for low-altitude cellular networks

Verify QoE in 5G networks with a scalable multiple network benchmarking solution and ensure the competitiveness of your network.

Increase the efficiency of your site verification and accelerate your 5G roll-out

Ensure network quality and end-user satisfaction of wireless networks with professional in-building measurement

Automated VoLTE testing gives mobile voice service providers an end-to-end way to measure voice quality and improve customer experience.

Ensure the performance of your 5G network indoors, benchmark your network against competitors

Dingli enhances outdoor network coverage with advanced 4G-5G RAN solutions, bridging the digital gap for urban and rural areas.

Dingli's Private Network Solutions offer secure, customizable, and efficient wireless communication for businesses, enhancing connectivity and operational efficiency.

Dingli's IoT Solutions offer innovative and scalable Internet of Things technologies, enabling smart connectivity and data-driven insights across various industries.

FWA, Fixed Wireless Access, provides high-speed broadband internet via wireless communication, bridging the digital divide in underserved areas.

Dingli excels in Indoor Network solutions, merging 4G reliability with swift 5G speeds for seamless mobile coverage in businesses and public spaces.

Elevator Networks, designed for elevators, uses 5G for high-speed connectivity, real-time monitoring, and seamless communication.

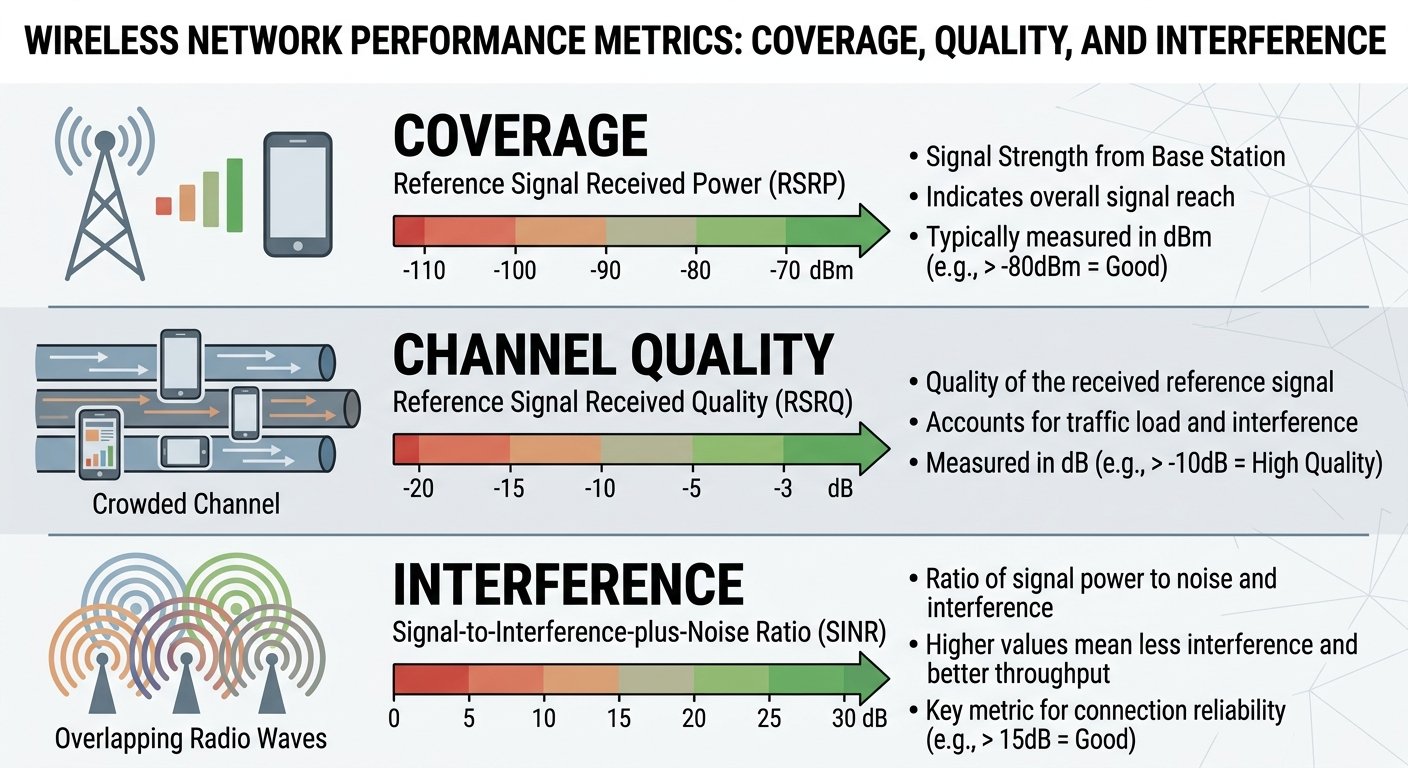
RSRP measures how strong the signal is, RSRQ measures how clean that signal is relative to everything else on the channel, and SINR measures how much interference is drowning it out. You need all three together because a phone can show full bars (good RSRP) and still deliver terrible throughput if RSRQ and SINR are poor. Treat them as a diagnostic hierarchy, not three interchangeable numbers on a dashboard, and your troubleshooting gets a lot faster.
Key takeaways
Most engineers can recite that RSRP is signal strength and SINR is interference. Fewer can explain why you need both, or what RSRQ is actually doing in between. Let's fix that in one place instead of stitching together three forum answers.
Reference Signal Received Power (RSRP) is the average power, in dBm, of the reference signals across the channel bandwidth. It is a pure coverage metric. It tells you nothing about congestion, interference, or whether the receiver can actually use that power to decode data. Per 3GPP TS 36.214, RSRP is measured on specific reference signal resource elements, which reduces (but does not fully eliminate) the influence of cell load and traffic conditions on the reading.
Reference Signal Received Quality (RSRQ) factors RSRP against RSSI, the total received power including interference and noise from every source on the channel. Expressed in dB, RSRQ answers a different question: is this channel crowded or noisy? A cell can deliver strong RSRP and still produce a mediocre RSRQ if neighboring sectors or heavy traffic load are chewing up the same spectrum.
Signal-to-Interference-plus-Noise Ratio compares wanted signal power to the sum of interference and noise. This is the number that most directly predicts whether a device can decode data cleanly and at what modulation order. Three questions, three answers: is the signal here (RSRP), is the channel congested or noisy (RSRQ), can the receiver decode it cleanly (SINR)?
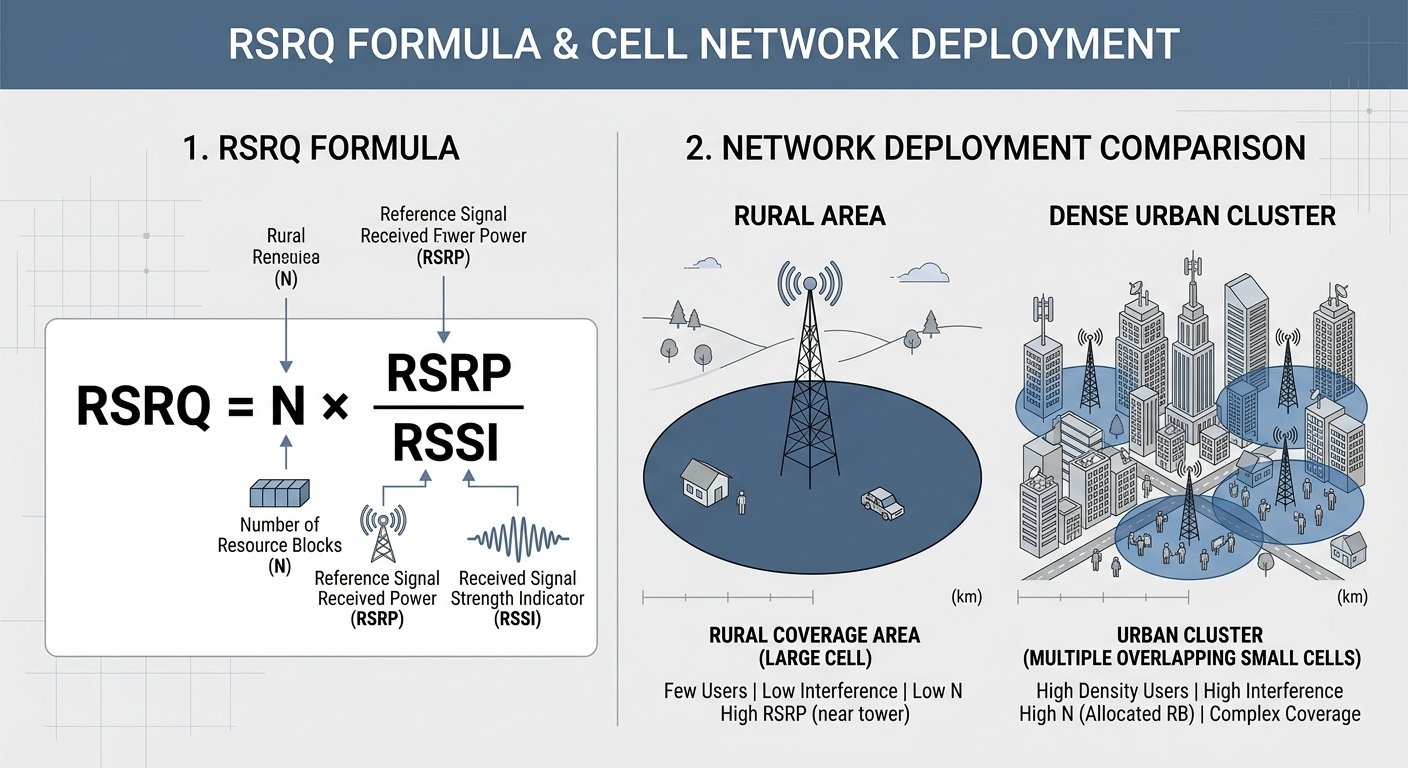
RSRQ stops feeling like an arbitrary second number once you see the formula: RSRQ = N x RSRP / RSSI, where N is the number of resource blocks over which RSSI is measured. RSSI includes interference, noise, and adjacent traffic, so RSRQ drops even when RSRP stays high, purely because the channel got busier.
This is exactly why two cell sites with identical RSRP can produce very different RSRQ readings depending on sector loading and neighbor interference. Take a hypothetical cell edge location reading -85 dBm RSRP in a quiet rural sector. It will likely show a healthier RSRQ than the same -85 dBm RSRP measured in a congested urban sector packed with overlapping small cells and heavy user traffic. Same coverage number, very different usable quality.
That distinction matters when you're reviewing logs. A drop in RSRQ without a corresponding drop in RSRP is a red flag for congestion or interference, not a coverage hole. Chasing it with a power boost won't help.
Here are the engineering reference ranges most RF teams use when scanning a drive test log or dashboard. These are commonly used rules of thumb, not hard 3GPP thresholds, and actual acceptable values vary by vendor, band, and deployment scenario.
| Rating | RSRP | RSRQ |
|---|---|---|
| Excellent | Above -80 dBm | Above -10 dB |
| Good | -80 to -90 dBm | -10 to -15 dB |
| Fair | -90 to -100 dBm | -15 to -20 dB |
| Poor | Below -100 dBm | Below -20 dB |
RSRP alone cannot predict user experience. It only confirms the signal physically reached the device. A phone sitting at -78 dBm RSRP can still deliver a frustrating browsing experience if RSRQ and SINR tell a worse story.
SINR is the metric most directly tied to achievable throughput and modulation scheme. Higher SINR allows higher-order modulation and a better CQI report, which is why it's the number engineers watch when a user complains about slow data despite full signal bars.
Low SINR despite strong RSRP almost always points to interference rather than weak coverage: overlapping cells, high sector loading, co-channel interference, or physical obstructions causing multipath reflections. Dense urban environments packed with overlapping small cells are a classic SINR killer, even in locations where RSRP looks perfectly healthy. If your SINR keeps dropping at the same location, stop looking at power and start looking at what else is transmitting on that channel.
The reason engineers get stuck on a single KPI is that they treat RSRP, RSRQ, and SINR as competing explanations instead of three layers of the same problem. As covered earlier, these layers divide cleanly into coverage, quality, and interference, and keeping that separation in mind is what prevents misdiagnosis.
Downstream service-level KPIs like throughput, CQI, BLER, and MOS all depend on these three layers, but they are not interchangeable with them. A good MOS score on a VoLTE call still needs a healthy RSRP, RSRQ, and SINR underneath it; the service-level number is the output, not the diagnosis.
| Metric | What it measures | Unit | Primary use case | Typical degrade cause |
|---|---|---|---|---|
| RSRP | Coverage / raw power | dBm | Cell selection, coverage mapping | Distance, obstruction, low TX power |
| RSRQ | Channel quality / load | dB | Handover triggers, congestion sensing | Sector loading, neighbor interference |
| SINR | Interference / decodability | dB | Throughput prediction, modulation | Overlapping cells, multipath |
This layered framework is also the basis for how 4G and 5G radio access networks are optimized, since the same coverage-quality-interference split applies across technologies.
Take a hypothetical drive test log showing RSRP at -75 dBm, well into the excellent range, paired with SINR at just 2 dB, solidly poor. Throughput and VoLTE MOS both suffer despite the strong bars the subscriber sees on their phone.
This pattern typically signals interference from overlapping cells, high network load, or in-building multipath rather than a coverage problem. The degradation comes from interference the receiver cannot cleanly separate from the wanted signal, not from a lack of signal strength.
Fixing it requires sector or antenna tuning and interference mitigation, not more transmit power. Boosting RSRP without addressing the interference source will not raise SINR, and in dense sectors it can even make things worse by adding to the noise floor other users experience. This is exactly the kind of correlation that automated and drive test platforms are built to capture across a route or building floor, logging RSRP, SINR, and throughput together so the interference pattern becomes visible on a map instead of buried in a spreadsheet.
The same three-layer logic carries over to 5G NR, just measured on a different reference signal. 5G NR defines SS-RSRP, SS-RSRQ, and SS-SINR, measured on the Synchronization Signal block (SSB) instead of LTE's cell-specific reference signals.
Conceptually the roles are identical: SS-RSRP for coverage, SS-RSRQ for channel quality, SS-SINR for interference and noise ratio. In some deployments, operators also make use of CSI-RS based measurements as a general industry practice for finer-grained quality reporting alongside SSB-based measurements, though the specifics depend on vendor configuration and network design. These definitions are formalized in 3GPP TS 38.215, the NR counterpart to LTE's TS 36.214.
One wrinkle engineers run into during the 5G rollout phase: in Non-Standalone (NSA) deployments, the device still anchors to an LTE cell for control signaling while using NR for data. That means a test log in NSA mode can show both LTE RSRP/RSRQ/SINR and NR SS-RSRP/SS-RSRQ/SS-SINR simultaneously, and both frameworks need to be read together to understand the full picture. Standalone (SA) 5G testing simplifies this to NR metrics alone. This is a core part of the transformation of network testing from 4G to 5G.
Reading these three metrics off a static table is one thing. Capturing them reliably across a moving vehicle, a multi-floor building, or a 24/7 monitoring window is a different challenge entirely.
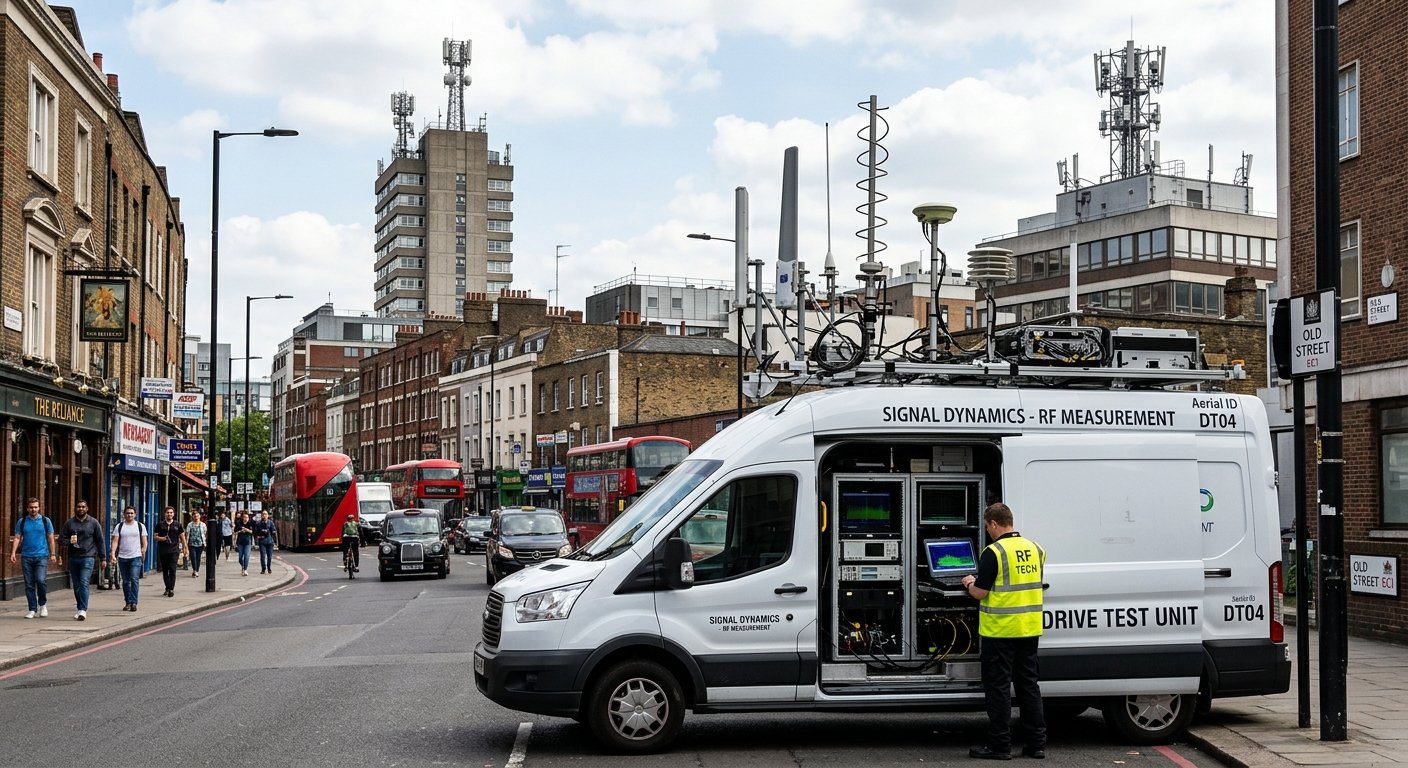
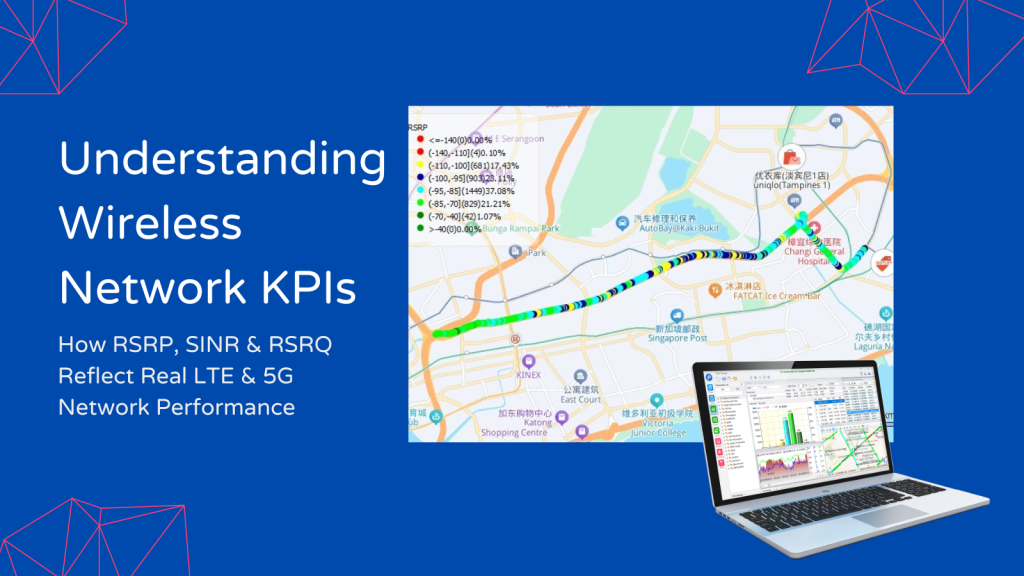
Drive testing along defined routes logs RSRP, RSRQ, and SINR continuously alongside GPS location, letting engineers map weak zones geographically rather than guessing from a single snapshot. Drive testing in telecom has evolved specifically to support this kind of continuous, route-based correlation.
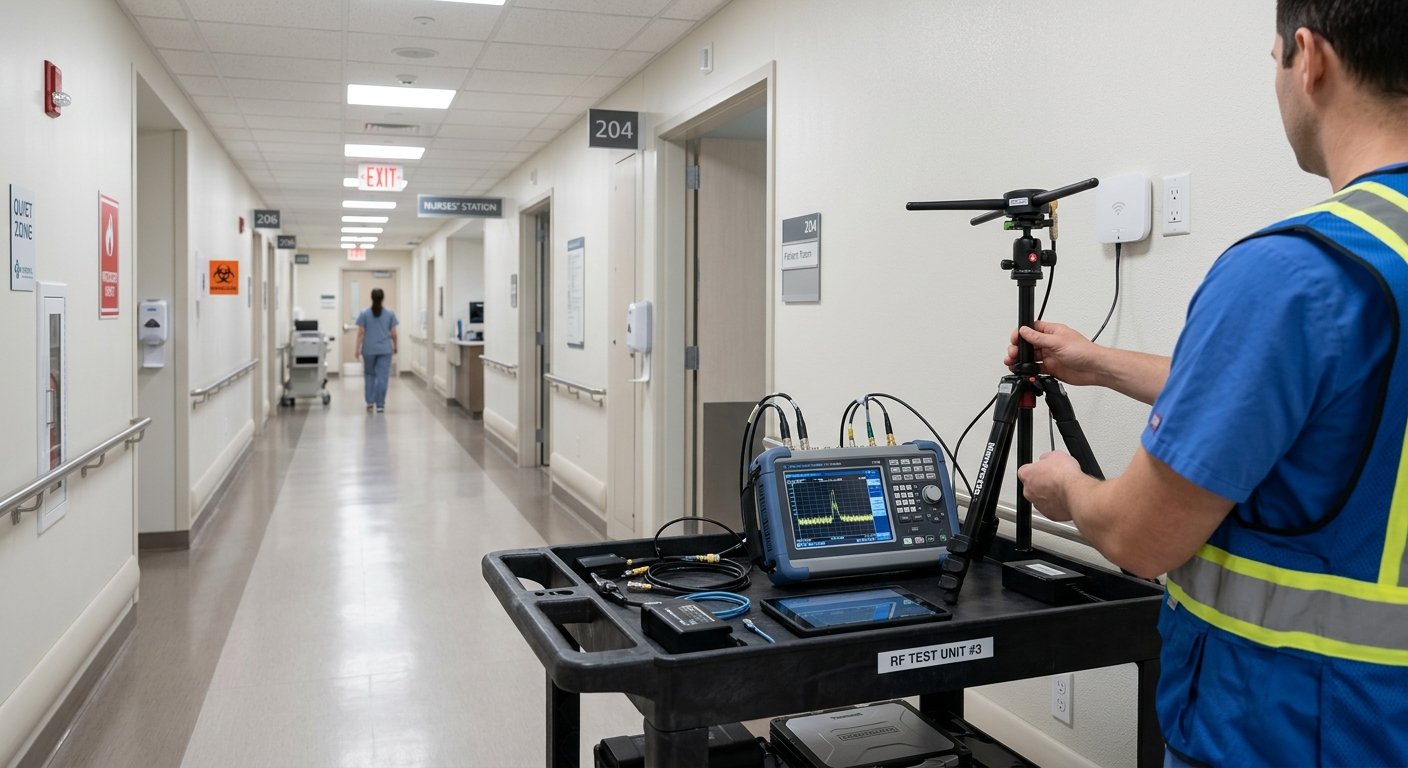
Indoor testing applies the same three metrics inside buildings, where multipath and wall attenuation create very different interference patterns than outdoor environments. A hospital corridor and a parking garage can produce wildly different RSRQ and SINR profiles even at similar RSRP levels.
Engineers then cross-reference RSRP, RSRQ, and SINR against CQI, BLER, and throughput logs to confirm whether a coverage, quality, or interference issue is the actual root cause. Automated and remote measurement approaches allow continuous KPI correlation over time instead of one-off snapshot tests, which matters when a problem only shows up during peak-hour congestion. Post-processing software is where this multi-KPI correlation, mapping, and benchmarking actually happens once raw logs are collected from the field.
The decision rule is simple: check RSRP first to confirm coverage exists, then RSRQ to see if the channel is clean, then SINR to confirm the receiver can actually decode the signal. Skip any one of these three checks and you risk applying the wrong fix. Adding transmit power will not solve an interference problem, and tuning antenna tilt won't fix a genuine coverage hole.
For consistent, route-based or building-wide correlation of these KPIs with throughput, handover, and voice quality, purpose-built drive test and indoor measurement tools remove the guesswork of manual logging. Dingli provides mobile network testing and measurement solutions for telecommunications operators, network equipment manufacturers, engineering service providers, and enterprises, with indoor network testing applications covering commercial buildings, hospitals, schools, shopping malls, and other indoor environments where this exact RSRP-RSRQ-SINR correlation needs to happen systematically rather than metric by metric.
Browse Dingli's RAN solutions or explore the broader resource library for more on structured network measurement.
As engineering rules of thumb, RSRP above -80 dBm and RSRQ above -10 dB are considered excellent. RSRP between -90 and -100 dBm with RSRQ between -15 and -20 dB is fair. These are not formal 3GPP thresholds, actual acceptable values vary by vendor and deployment.
SINR above 20 dB is excellent and typically supports the highest-order modulation and peak throughput. 13 to 20 dB is good, 0 to 13 dB is fair with reduced throughput, and below 0 dB is poor, usually causing severe throughput loss and degraded call quality.
Low SINR despite strong RSRP almost always points to interference rather than weak coverage: overlapping cells, high sector loading, co-channel interference, or multipath from physical obstructions. Dense urban areas with many overlapping small cells are a common cause even where signal strength looks fine.
RSRP above -80 dBm is generally considered excellent coverage, -80 to -90 dBm is good, and below -100 dBm is poor. But RSRP alone only confirms the signal reached the device; it says nothing about channel quality or interference, so it can't predict actual user experience on its own.



If you are interested in our services or need customized solutions, please feel free to contact us
Contact UsComplete the form below to have a sales person address your business needs.

