Support Portal
Discover our Support Portal, your one-stop destination for accessing essential resources such as brochures, product datasheets, operation guides, and more.
Explore
Pilot Wireless Network

Small Cell
Drive Test/Outdoor Test

Indoor Test

Autonomous Measurement
Laboratory Automation
Post Processing

Drone-based Testing
Dingli's Pilot Wireless Network Solution is instrumental in ensuring seamless signal transmission between base stations and mobile devices. This cutting-edge solution is tailored to improve the performance, reliability, and efficiency of wireless networks, delivering enhanced network quality and user experience.
Read More Find the related productsSmall Cell Networks power the next wave of wireless innovation, delivering high-quality, reliable connectivity for demanding environments like smart enterprises and hospitals
Read More Find the related productsDrive tests unlock real-world visibility into 4G/5G performance, enabling operators to enhance coverage, signal quality, and user experience.
Read More Find the related productsIndoor Network Test Solutions are essential for evaluating and optimizing cellular networks in indoor environments. Designed to tackle connectivity challenges, they ensure seamless performance in spaces like shopping malls, hospitals, offices, residences, schools, and underground parking lots.
Read More Find the related productsAutonomous Measurement uses advanced tools to monitor and validate network performance, streamlining evaluation and reducing manual effort.
Read More Find the related productsLab test solutions verify 4G/5G performance and reliability before deployment, ensuring every component meets the highest standards
Read More Find the related productsDingli provides cutting-edge Post Processing solutions and a powerful software platform for network analysis and benchmarking, maximizing performance and reliability.
Read More Find the related productsDingli Drone-Based Testing is an automated solution designed for the emerging low-altitude economy, enabling precise 5G vertical coverage analysis.
Read More Find the related products
Enables seamless smart applications, reliable connectivity, and enhanced driving safety

Cost-effective NB-IoT/Emtc testing solution includes essential measurement functionality, signaling test and enhanced capabilities such as failure alrams and post processing

Measure QoS and QoE for all OTT applications and services

Accelerate digital transformation and improve reliability, efficiency and productivity

Measures and analyzes network performance for low-altitude cellular networks

Verify QoE in 5G networks with a scalable benchmarking solution and ensure the competitiveness of your network

Increase the efficiency of your site verification and accelerate your 5G roll-out

Ensure network quality and end-user satisfaction of wireless networks with professional in-building measurement

Enables mobile voice service provider with a comprehensive, end-to-end solution to ensure better customer experience

Ensure the performance of your 5G network indoors, benchmark your network against competitors

Dingli enhances outdoor network coverage with advanced 4G-5G RAN solutions, bridging the digital gap for urban and rural areas.

Dingli's Private Network Solutions offer secure, customizable, and efficient wireless communication for businesses, enhancing connectivity and operational efficiency.

Dingli's IoT Solutions offer innovative and scalable Internet of Things technologies, enabling smart connectivity and data-driven insights across various industries.

FWA, Fixed Wireless Access, provides high-speed broadband internet via wireless communication, bridging the digital divide in underserved areas.

Dingli excels in Indoor Network solutions, merging 4G reliability with swift 5G speeds for seamless mobile coverage in businesses and public spaces.

Elevator Networks, designed for elevators, uses 5G for high-speed connectivity, real-time monitoring, and seamless communication.
One of the most common misunderstandings in wireless network evaluation is assuming that strong signal strength automatically means good network performance.
In practice, most RF engineers know that this is rarely true.
A subscriber may see full signal bars while experiencing poor video quality, unstable data sessions, or disappointing download speeds. On the other hand, a network with only moderate signal levels may still deliver an excellent user experience if radio quality and interference conditions are properly controlled.
This is why experienced optimization engineers rarely rely on a single KPI.
In real LTE and 5G optimization projects, performance evaluation depends on interpreting multiple KPIs together and understanding what they actually indicate in a specific scenario.
For example:
The challenge is that many wireless KPIs are frequently misunderstood — especially by teams that are new to RF optimization, benchmarking, or acceptance testing.
Terms such as RSRP, SINR, RSRQ, RSSI, PCI, and EARFCN appear in every drive test report, yet many engineers still struggle to interpret what these metrics actually reveal about network conditions.
This becomes even more important in scenarios such as:
In these projects, collecting KPI data is only the first step.
The real value comes from correct interpretation.
Because in wireless optimization:
Bad measurements lead to bad conclusions.
Bad conclusions lead to bad optimization decisions.
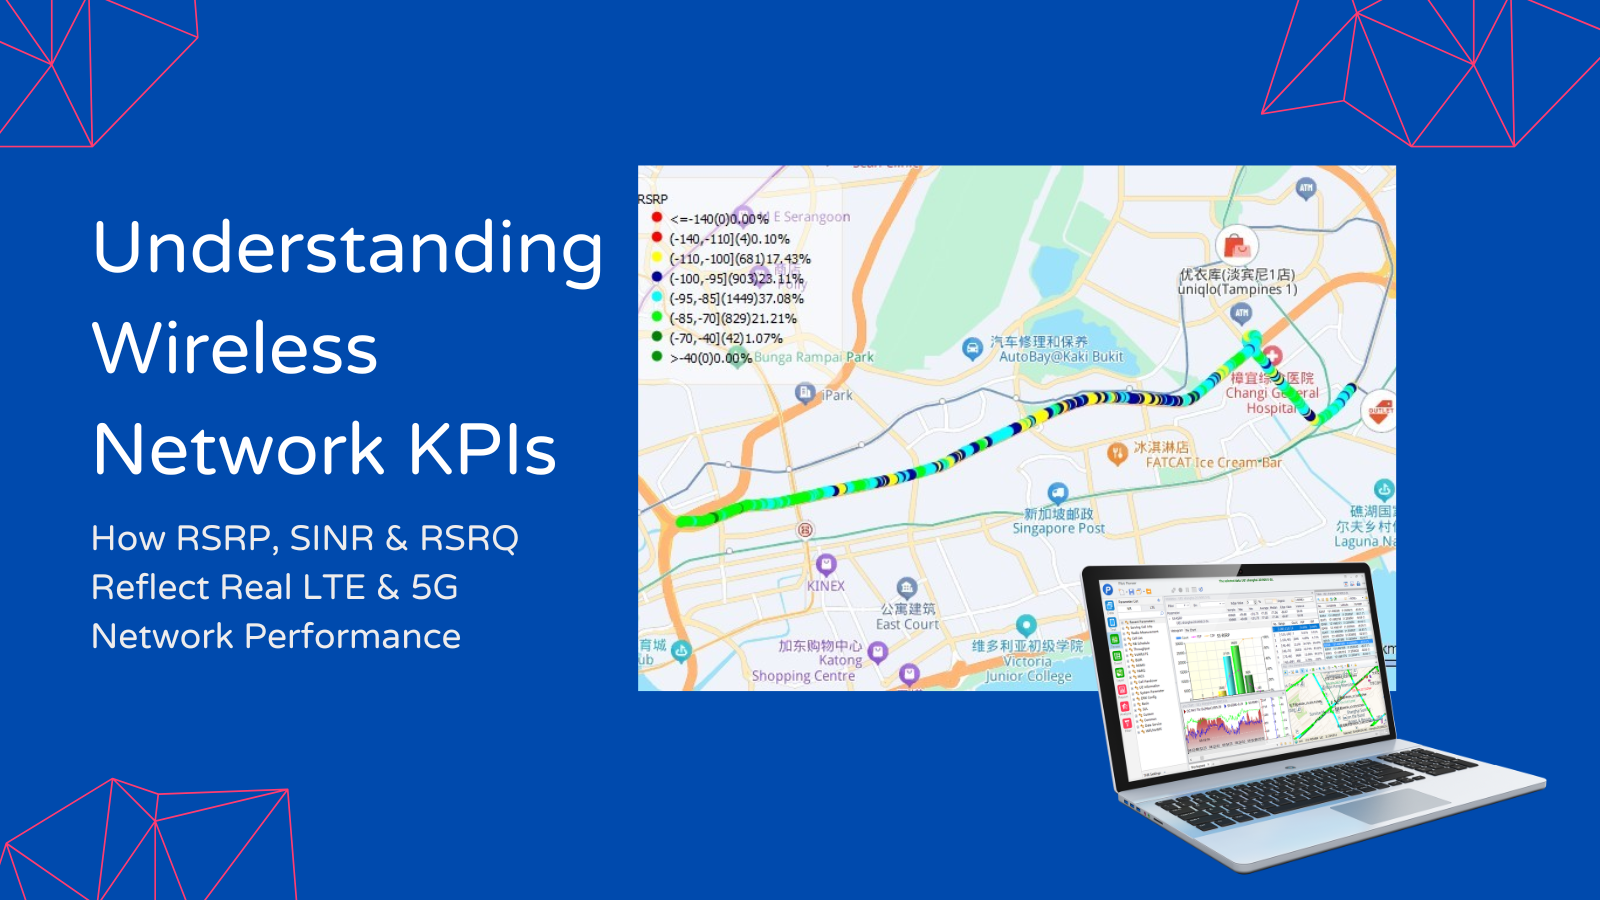
This article takes a practical engineering perspective to explain how core wireless KPIs reflect real network performance, how they should be interpreted together, and how RF teams actually use them in day-to-day optimization work.
For people outside telecom engineering, KPIs are often treated as numbers on a dashboard.
For RF optimization teams, however, KPIs are diagnostic tools.
They help engineers answer practical questions such as:
Is this a coverage problem?
Is interference the root cause?
Is user experience impacted by congestion?
Why is mobility performance unstable?
The answers usually come from KPI interpretation.
The first objective in many optimization projects is understanding whether the network provides sufficient coverage.
This applies to:
In these scenarios, engineers primarily look at RSRP, supported by coverage maps and route analysis.
Weak RSRP generally indicates a coverage issue, but experienced engineers also check neighboring cells, terrain conditions, and frequency layers before drawing conclusions.
Because not every weak signal problem is caused by insufficient coverage.
Sometimes:
The signal exists — but the serving cell selection is wrong.
One of the most time-consuming problems in LTE and 5G optimization is interference.
Typical symptoms include:
In these cases, SINR becomes more important than signal strength.
It is common to see locations where:
| KPI | Value |
| RSRP | Excellent |
| SINR | Poor |
| User Experience | Unsatisfactory |
Junior engineers often misinterpret these situations.
They see strong coverage and assume the network is healthy.
Experienced RF engineers usually think differently:
Strong signal with poor quality often means interference.
Common causes include:
This is where drive testing and post-processing become critical.
Benchmarking projects introduce another layer of complexity.
Operators and regulators do not simply compare signal strength.
They evaluate:
A network with the strongest signal is not always the best-performing network.
In many benchmarking projects, networks with slightly weaker RSRP outperform competitors because of:
This is why benchmarking methodologies typically combine:
Coverage KPIs + Quality KPIs + User Experience KPIs
instead of relying on a single metric.
Mobility scenarios often expose optimization problems that stationary testing cannot detect.
This is especially true for:
A network may perform well when users are stationary but struggle once mobility increases.
Common symptoms include:
In these scenarios, engineers evaluate radio KPIs together with mobility indicators such as:
A healthy mobility network depends on more than strong coverage.
It depends on consistent radio quality and intelligent mobility management.
For many operators, KPI analysis becomes most critical during:
The objective is no longer only to identify problems.
It becomes:
Can network performance be objectively verified?
This is where standardized testing methodologies matter.
Whether through drive testing, walk testing, or automated benchmarking, reliable KPI collection enables engineering teams to validate:
Because ultimately:
Optimization without measurement is only assumption.
Before discussing individual KPIs, it is important to understand one principle:
No single KPI can fully represent network performance.
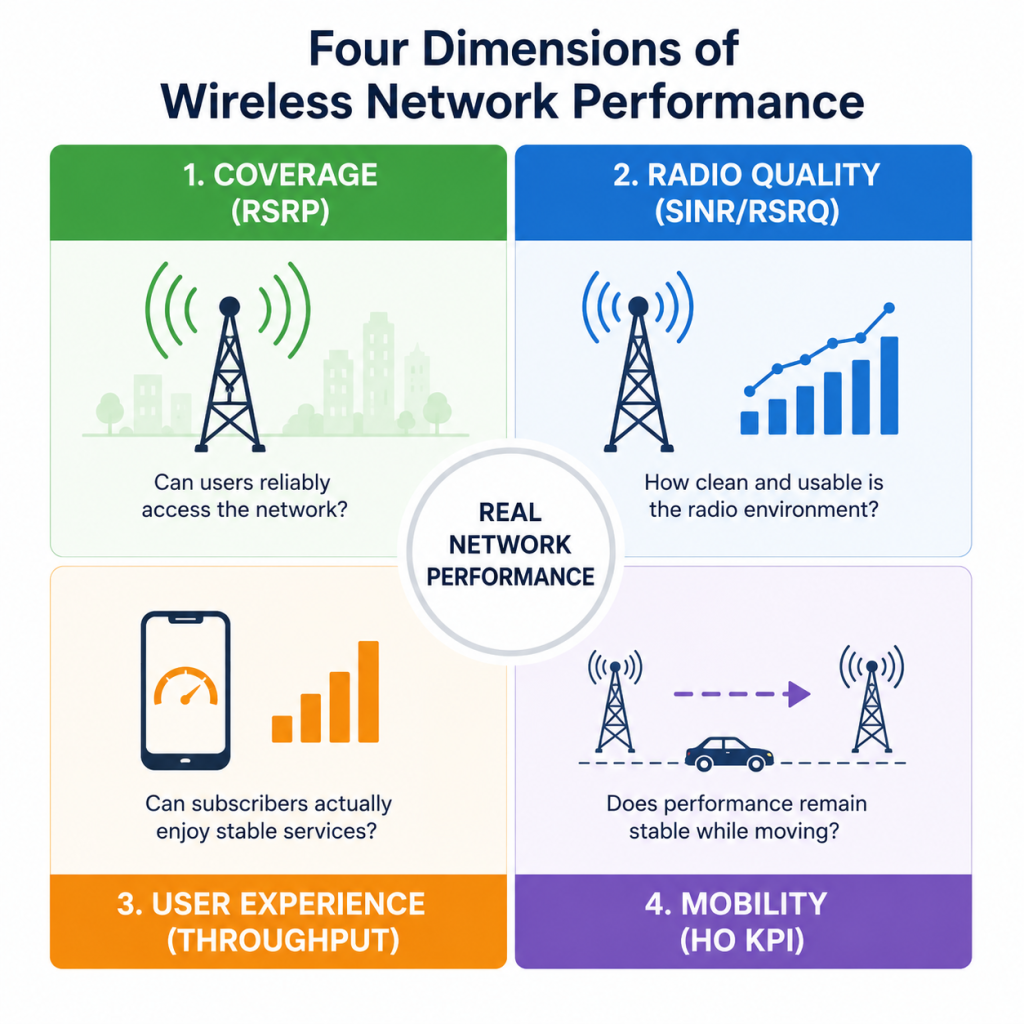
In real-world optimization, engineers evaluate performance from four different dimensions:
Can users reliably access the network?
How clean and usable is the radio environment?
Can subscribers actually enjoy stable services?
Does performance remain stable while moving?
Each dimension relies on different KPIs.
And misunderstanding this relationship is one of the most common reasons optimization efforts fail.
In LTE and 5G optimization, RSRP (Reference Signal Received Power) is usually the first KPI engineers check when evaluating network coverage.
Simply put:
RSRP reflects how strong the serving cell signal is at the UE side.
But in practical optimization work, engineers rarely stop at signal strength alone.
Because a strong signal does not necessarily guarantee good performance.
RSRP primarily answers one question:
Can the network reliably provide coverage in a given location?
This makes it one of the most widely used KPIs in:
During post-processing, RSRP maps quickly reveal:
For example, during a nationwide benchmarking campaign, low RSRP clusters often indicate:
However, experienced engineers know that low RSRP alone should never immediately trigger optimization actions.
Because in many cases:
The issue is not missing coverage — but poor serving cell selection.
For example:
A UE may remain attached to a distant macro cell instead of camping on a nearby small cell due to:
This is why RF engineers always evaluate:
RSRP + PCI + serving cell behavior
rather than signal strength alone.
While thresholds vary between operators and frequency layers, a commonly accepted reference is:
| RSRP | Interpretation |
| > -80 dBm | Excellent |
| -80 to -90 dBm | Good |
| -90 to -100 dBm | Fair |
| -100 to -110 dBm | Weak |
| < -110 dBm | Poor coverage |
These values are useful during:
But context always matters.
For example:
A rural low-band deployment may still provide acceptable service at -105 dBm, while dense urban environments typically require stronger levels to maintain premium user experience.
Consider a common enterprise complaint:
“Voice is acceptable, but video meetings are unstable indoors.”
Drive test results may show:
| KPI | Value |
| RSRP | -108 dBm |
| SINR | 15 dB |
| Throughput | Low |
Interpretation:
Radio quality is acceptable.
The problem is primarily:
Coverage limitation due to penetration loss.
Typical optimization options may include:
One mistake often seen among junior engineers is treating RSRP as the ultimate KPI.
In reality:
RSRP only reflects signal availability.
It does not reflect signal usability.
Two networks may show similar RSRP values while delivering completely different user experiences.
Because coverage strength alone does not account for:
This is where SINR becomes critical.
If RSRP answers:
“Can users receive signal?”
Then SINR (Signal-to-Interference-plus-Noise Ratio) answers:
“How usable is that signal?”
Among all wireless KPIs, SINR is arguably the most important indicator of real radio quality.
In many optimization projects:
Engineers care more about SINR than signal bars.
Because poor SINR almost always leads to poor user experience.
A useful way to think about SINR is:
How clean is the radio environment?
Imagine having a conversation in a crowded restaurant.
Even if the other person speaks loudly:
You still struggle to understand them if the background noise is overwhelming.
This is exactly how poor SINR behaves in wireless networks.
Strong signal.
Poor clarity.
Bad performance.
Low SINR often suggests:
Such as:
Including:
Such as:
| SINR | Interpretation |
| > 20 dB | Excellent |
| 13–20 dB | Good |
| 0–13 dB | Moderate |
| < 0 dB | Poor |
| < -5 dB | Severe interference |
In real optimization work:
Throughput degradation often begins long before SINR becomes negative.
For premium LTE and 5G experience, operators typically aim for:
SINR above 10–15 dB
especially in urban areas.
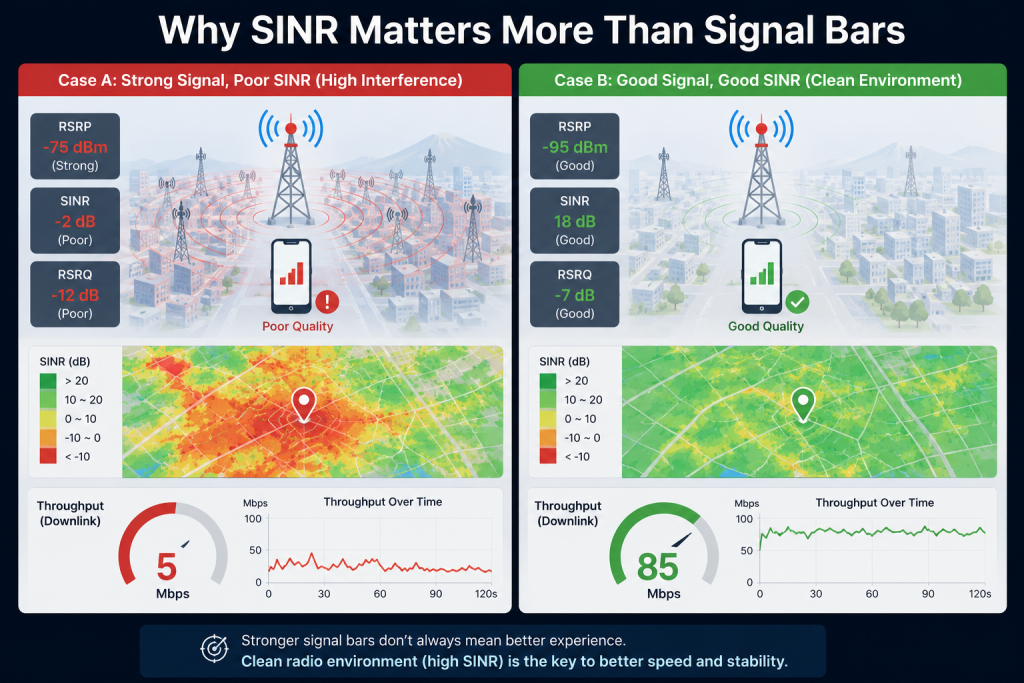
This scenario appears frequently.
Customer complaint:
“Coverage looks good, but speed is terrible.”
Drive test findings:
| KPI | Value |
| RSRP | -78 dBm |
| SINR | -2 dB |
| Throughput | Poor |
Interpretation:
This is not a coverage problem.
The issue is:
Interference-driven quality degradation.
Common root causes include:
In these cases:
Adding more sites may actually worsen performance.
The correct approach is usually:
Interference optimization, not coverage expansion.
Modern LTE and 5G networks rely heavily on:
Poor SINR reduces the network’s ability to use:
As a result:
Even with excellent RSRP, throughput may remain disappointing.
This is why:
Strong signal without clean radio quality rarely delivers premium user experience.
Compared with RSRP and SINR, RSRQ (Reference Signal Received Quality) is often misunderstood.
Many engineers look at RSRQ but struggle to interpret what it actually reflects.
A practical way to think about it is:
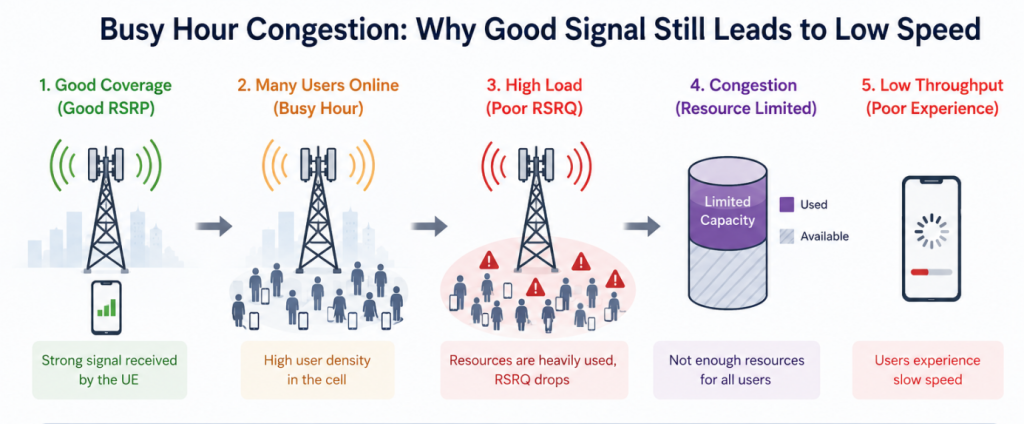
RSRQ reflects both radio quality and network loading conditions.
Unlike RSRP:
RSRQ is influenced by:
This makes it particularly useful for diagnosing:
Congestion-related performance problems.
Poor RSRQ typically indicates:
Busy-hour performance degradation.
Too many active users.
Especially in dense urban areas.
Resource allocation limitations.
| RSRQ | Interpretation |
| > -8 dB | Excellent |
| -8 to -10 dB | Good |
| -10 to -12 dB | Fair |
| < -12 dB | Poor |
A classic example:
| KPI | Value |
| RSRP | Good |
| SINR | Acceptable |
| RSRQ | Poor |
| Throughput | Low |
Interpretation:
The radio environment is healthy.
But:
The network is likely overloaded.
This often happens in:
In such cases:
Coverage optimization alone will not solve the problem.
Capacity expansion becomes necessary.
When discussing LTE and 5G KPI analysis, most attention naturally goes to:
However, experienced optimization engineers know that secondary KPIs often provide the missing context needed to explain network behavior.
Among them, RSSI, PCI, and EARFCN are frequently underestimated.
Yet in many troubleshooting scenarios, these supporting indicators reveal the actual root cause.
RSSI (Received Signal Strength Indicator) measures:
Total received power
including:
This means:
RSSI reflects everything the UE hears — not only useful signal.
Unlike RSRP, RSSI alone provides limited optimization value in LTE and 5G.
For this reason:
Most operators prioritize RSRP over RSSI during coverage evaluation.
However, RSSI still becomes useful when diagnosing:
For example:
| KPI | Value |
| RSRP | Good |
| RSSI | High |
| SINR | Poor |
Interpretation:
The UE receives significant total power, but signal quality is degraded.
This often indicates:
Interference rather than coverage deficiency.
PCI (Physical Cell Identity) is often overlooked until mobility problems begin appearing.
In practice:
PCI planning can directly impact mobility performance and user experience.
Poor PCI design commonly leads to:
Different cells share the same PCI.
Result:
UE confusion during mobility.
Neighboring cells have ambiguous identification.
Result:
Imagine a highway testing scenario.
KPIs look healthy:
| KPI | Value |
| RSRP | Good |
| SINR | Good |
| Throughput | Stable |
Yet:
Voice calls continue dropping during mobility.
Post-processing analysis reveals:
PCI confusion in neighboring sectors.
The issue is not radio quality.
It is:
Mobility planning failure.
This is why mature optimization teams always analyze:
Radio KPIs + mobility behavior together.
EARFCN (E-UTRA Absolute Radio Frequency Channel Number) identifies:
Which LTE frequency layer the UE is connected to
For engineers, EARFCN helps answer important questions such as:
Is the UE camping on the correct frequency layer?
Is carrier aggregation functioning properly?
Are mobility decisions behaving as expected?
For example:
In many optimization projects:
Operators expect users to migrate from:
low-band coverage layer
to:
mid-band or high-band capacity layer
If EARFCN analysis shows the UE remaining on low-band excessively:
It may indicate:
This is one of the most common questions in wireless optimization.
The short answer is:
No single KPI can fully represent network performance.
Each KPI reflects a different dimension of network behavior.
| KPI | What It Reflects | Main Use Case | Limitation |
| RSRP | Coverage strength | Coverage evaluation | Cannot reflect interference |
| SINR | Signal quality | Radio quality analysis | Not sufficient for load diagnosis |
| RSRQ | Signal quality + load | Congestion analysis | Less intuitive |
| Throughput | User experience | Service validation | Affected by many factors |
A useful engineering interpretation is:
Can users access the network?
Can users receive usable signal quality?
Is the network healthy under loading?
Do users actually experience good performance?
This explains why experienced RF teams rarely optimize based on one KPI.
Instead:
They analyze KPI combinations.
The real value of KPI analysis comes from interpretation.
Below are several common scenarios seen during optimization projects.
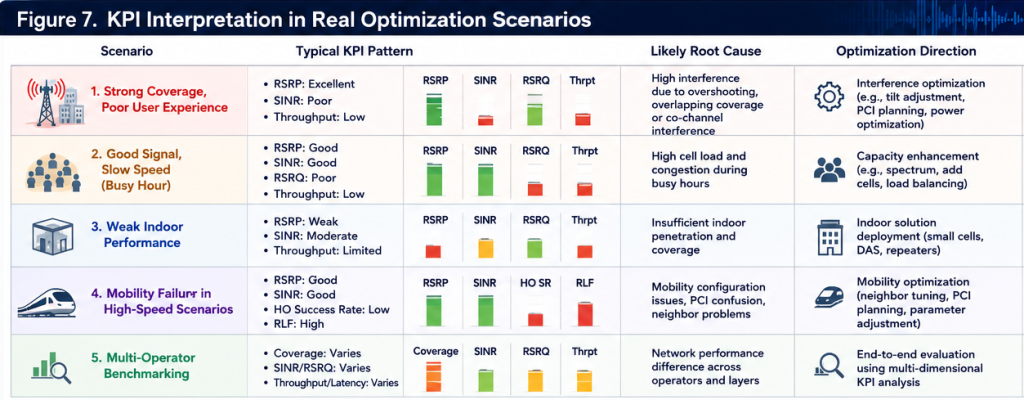
Drive test result:
| KPI | Value |
| RSRP | Excellent |
| SINR | Poor |
| Throughput | Low |
Interpretation:
Coverage exists.
But quality is degraded.
Likely causes:
Optimization direction:
Interference mitigation.
Not new site deployment.
Results:
| KPI | Value |
| RSRP | Good |
| SINR | Good |
| RSRQ | Poor |
| Throughput | Low |
Interpretation:
The radio environment is healthy.
Problem:
Capacity limitation.
Typical root causes:
Optimization direction:
Capacity enhancement.
Results:
| KPI | Value |
| RSRP | Weak |
| SINR | Moderate |
| Throughput | Limited |
Interpretation:
Coverage issue.
Most likely caused by:
penetration loss.
Optimization options:
High-speed rail optimization introduces unique challenges.
Common symptoms:
KPI evaluation requires combining:
Because:
Good stationary performance does not guarantee good mobility performance.
In benchmarking projects, operators often ask:
Which network performs best?
The answer is rarely based on signal strength alone.
A complete evaluation typically includes:
RSRP
SINR / RSRQ
Throughput / Latency
Mobility continuity
This is why professional benchmarking frameworks always rely on:
Multi-dimensional KPI evaluation.
In practical optimization work, engineers usually analyze KPI combinations rather than isolated indicators.
| Problem Type | KPI Combination |
| Coverage issue | RSRP + PCI |
| Interference problem | SINR + RSRQ |
| User complaint | Throughput + SINR |
| Mobility issue | PCI + Handover KPI |
| Benchmarking | Coverage + QoE KPIs |
| Capacity issue | RSRQ + Throughput |
This approach improves troubleshooting efficiency and prevents incorrect conclusions.
Because:
Optimizing the wrong problem often makes network performance worse.
Wireless KPIs are not merely reporting metrics.
They are engineering indicators used to understand:
What the network is actually experiencing.
RSRP tells engineers whether coverage exists.
SINR explains whether the signal is usable.
RSRQ reflects loading and radio quality conditions.
Together, they create a more complete picture of real network performance.
But ultimately:
KPIs only become valuable when interpreted correctly and validated through real-world measurements.
This is why professional network optimization still depends heavily on:
Because:
Good optimization decisions are built on good measurements.
And good measurements begin with understanding what wireless KPIs are really saying.

Accurate KPI interpretation starts with reliable field data.
Whether for:
professional testing methodologies remain essential for objective network evaluation.
Explore Dingli’s wireless network testing solutions for drive testing, walk testing, benchmarking, and automated network performance validation.


If you are interested in our services or need customized solutions, please feel free to contact us
Contact UsComplete the form below to have a sales person address your business needs.

