
Support Portal
Discover our Support Portal, your one-stop destination for accessing essential resources such as brochures, product datasheets, operation guides, and more.
Explore
Pilot Wireless Network

Small Cell

Drive Test/Outdoor Test

Indoor Test

Autonomous Measurement

Laboratory Automation

Post Processing

Drone-based Testing
Dingli's Pilot Wireless Network Solution is instrumental in ensuring seamless signal transmission between base stations and mobile devices. This cutting-edge solution is tailored to improve the performance, reliability, and efficiency of wireless networks, delivering enhanced network quality and user experience.
Read More Find the related productsSmall Cell Networks power the next wave of wireless innovation, delivering high-quality, reliable connectivity for demanding environments like smart enterprises and hospitals
Read More Find the related productsDingli's LTE drive test solutions give mobile operators real-world visibility into outdoor 4G and 5G performance, measuring coverage, signal quality, throughput, handover and service experience along defined test routes.
Read More Find the related productsIndoor cellular coverage tester solutions evaluate and optimize networks in malls, hospitals, offices, residences, schools, and underground parking lots.
Read More Find the related productsAutonomous Measurement uses advanced tools to monitor and validate network performance, streamlining evaluation and reducing manual effort.
Read More Find the related productsLab test solutions verify 4G/5G performance and reliability before deployment, ensuring every component meets the highest standards
Read More Find the related productsDingli provides cutting-edge Post Processing solutions and a powerful software platform for network analysis and benchmarking, maximizing performance and reliability.
Read More Find the related productsDingli Drone-Based Testing is an automated solution designed for the emerging low-altitude economy, enabling precise 5G vertical coverage analysis.
Read More Find the related products
Enables seamless smart applications, reliable connectivity, and enhanced driving safety

This cost-effective NB-IoT testing and eMTC testing solution includes essential measurements, signaling tests, failure alarms, and post-processing.

Measure QoS and QoE for all OTT applications and services

Accelerate digital transformation with 5G private network testing that improves reliability, efficiency and productivity.

Measures and analyzes network performance for low-altitude cellular networks

Verify QoE in 5G networks with a scalable multiple network benchmarking solution and ensure the competitiveness of your network.

Increase the efficiency of your site verification and accelerate your 5G roll-out

Ensure network quality and end-user satisfaction of wireless networks with professional in-building measurement

Automated VoLTE testing gives mobile voice service providers an end-to-end way to measure voice quality and improve customer experience.

Ensure the performance of your 5G network indoors, benchmark your network against competitors

Dingli enhances outdoor network coverage with advanced 4G-5G RAN solutions, bridging the digital gap for urban and rural areas.

Dingli's Private Network Solutions offer secure, customizable, and efficient wireless communication for businesses, enhancing connectivity and operational efficiency.

Dingli's IoT Solutions offer innovative and scalable Internet of Things technologies, enabling smart connectivity and data-driven insights across various industries.

FWA, Fixed Wireless Access, provides high-speed broadband internet via wireless communication, bridging the digital divide in underserved areas.

Dingli excels in Indoor Network solutions, merging 4G reliability with swift 5G speeds for seamless mobile coverage in businesses and public spaces.

Elevator Networks, designed for elevators, uses 5G for high-speed connectivity, real-time monitoring, and seamless communication.

High RSRP with low SINR means the cell signal itself is strong enough, but something else, usually interference from other cells, noise, or a confused handover state, is drowning it out. RSRP tells you the serving cell is close and loud; SINR tells you whether the receiver can actually separate that signal from everything else hitting the antenna. When they disagree, the fix is never ‘get closer to the tower’: it’s finding and removing the interference source.
Key Takeaways
RSRP and SINR answer two completely different engineering questions, and conflating them is where most troubleshooting goes wrong. RSRP measures the reference signal power coming from the serving cell and nothing else. It doesn’t care what the neighboring cells are doing, how loaded the channel is, or whether three other sectors are shouting over the same resource blocks.
SINR, on the other hand, reflects the entire RF environment. It’s the ratio of your serving cell’s signal to everything competing with it: interference from neighbor cells plus thermal and external noise. That’s why a device can report an excellent -70 dBm RSRP while SINR sits near 0 dB. Every neighbor cell is landing on the same resource elements at comparable power, and the receiver simply can’t pull your serving cell’s signal cleanly out of that mess.
This is also why the instinct to ‘boost power or move closer’ often backfires, a point worth keeping in mind as you work through the diagnostic steps below. For a fuller breakdown of how these metrics relate to RSRQ as well, see RSRP vs RSRQ vs SINR: Understanding the Three Pillars of LTE and 5G Signal Quality.
If RSRP looks fine but SINR is in the gutter, one of these mechanisms is almost always responsible:
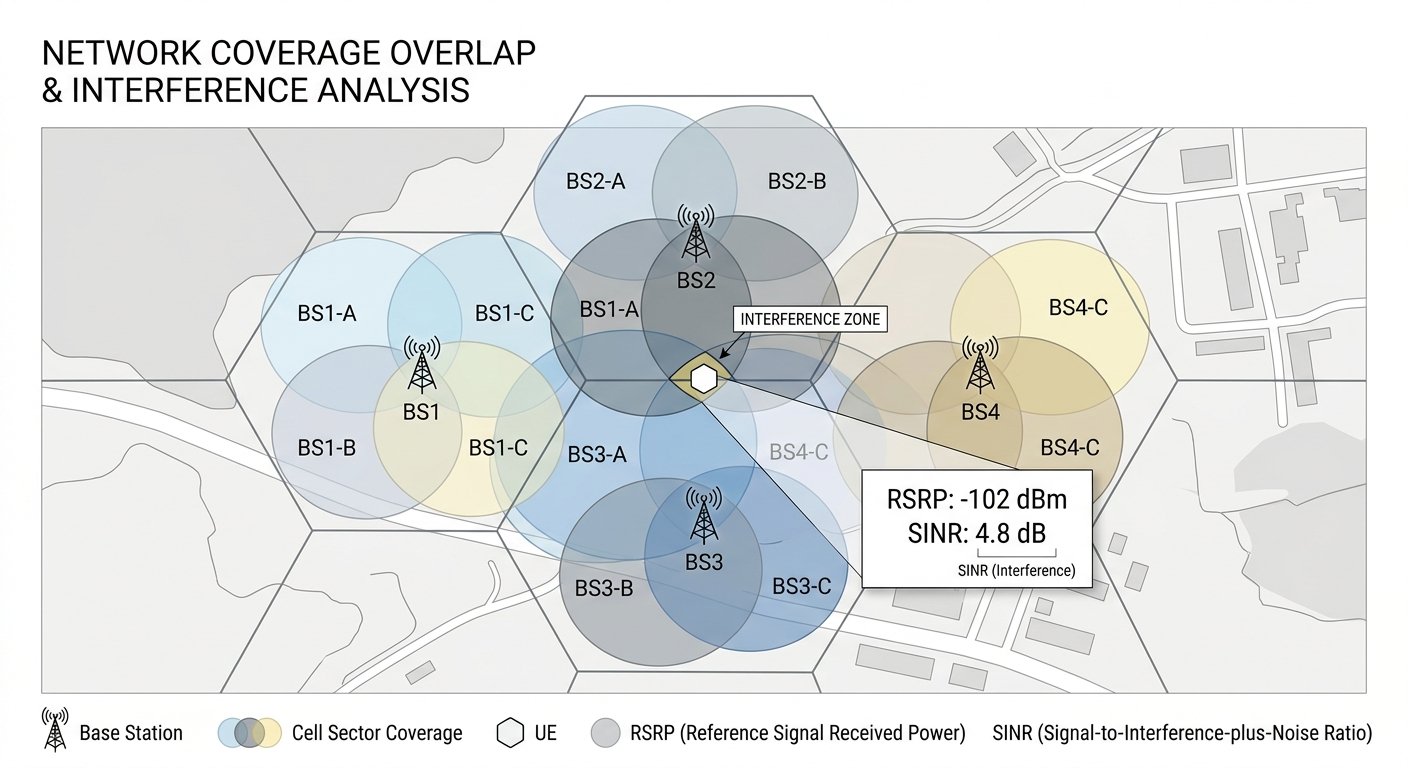
A single SINR reading means little without context on what it actually does to the user experience. The table below maps illustrative SINR bands to the symptoms an engineer would see on a drive test log or live KPI dashboard.
| SINR Range | Label | Typical Symptom |
|---|---|---|
| Above ~20 dB | Excellent | Near-peak MCS/CQI selection, maximum achievable throughput |
| 13-20 dB | Good | Stable throughput, minor retransmissions |
| 0-13 dB | Fair | Lower MCS selection, rising BLER, noticeable throughput drop |
| Below 0 dB | Poor | Session instability, VoLTE/VoNR MOS degradation, failed or ping-ponging handovers |
These bands are illustrative engineering reference points, not a guaranteed threshold for every chipset or vendor implementation. A consumer-grade tool might still display a ‘good signal’ icon based on RSRP alone while the actual achievable throughput, tied to SINR-driven MCS selection, tells a very different story. That gap is exactly why professional drive testing looks at SINR, not just bars.
Typical RSRP ranges run from around -50 dBm (very close to the site) down to -110 or -120 dBm (cell edge), with -80 to -90 dBm generally considered solidly usable coverage. But that number only confirms coverage exists. It says nothing about whether the link can actually sustain high data rates.
This is the trap many site planners fall into: optimizing purely for RSRP targets during rollout. Push enough transmit power and downtilt adjustments to guarantee strong RSRP everywhere, and you can inadvertently create pilot pollution zones. Coverage maps look excellent. SINR between those zones is terrible. The network looks great on a heat map and performs poorly in practice.
That’s why RF planning and optimization work, covered in more depth in Optimizing 4G Radio Access Network for Better Coverage and Capacity, has to treat RSRP and SINR as a pair, never in isolation.
No, and this is where most generic explainer articles stop short. In 5G Non-Standalone (NSA), the device anchors control signaling on LTE while using NR for data throughput. That means a strong LTE RSRP can completely mask a weak NR SS-SINR on the secondary carrier, the device stays attached and looks healthy, but data throughput on the NR leg quietly suffers.
SS-RSRP and SS-SINR are measured per SSB beam rather than per omni-sector, which introduces a different kind of overlap problem: beam-level interference between neighboring gNBs. The same high-power, low-quality mismatch can occur, but it’s driven by beamforming geometry rather than classic cell-edge overlap.
In Standalone (SA) deployments, where both control and data ride on NR, a low SS-SINR has a far more direct and immediate impact, since there’s no LTE anchor to fall back on for access. Engineers testing 5G sites need to log SS-RSRP, SS-SINR, and LTE RSRP/SINR as separate datasets rather than assuming one explains the other.
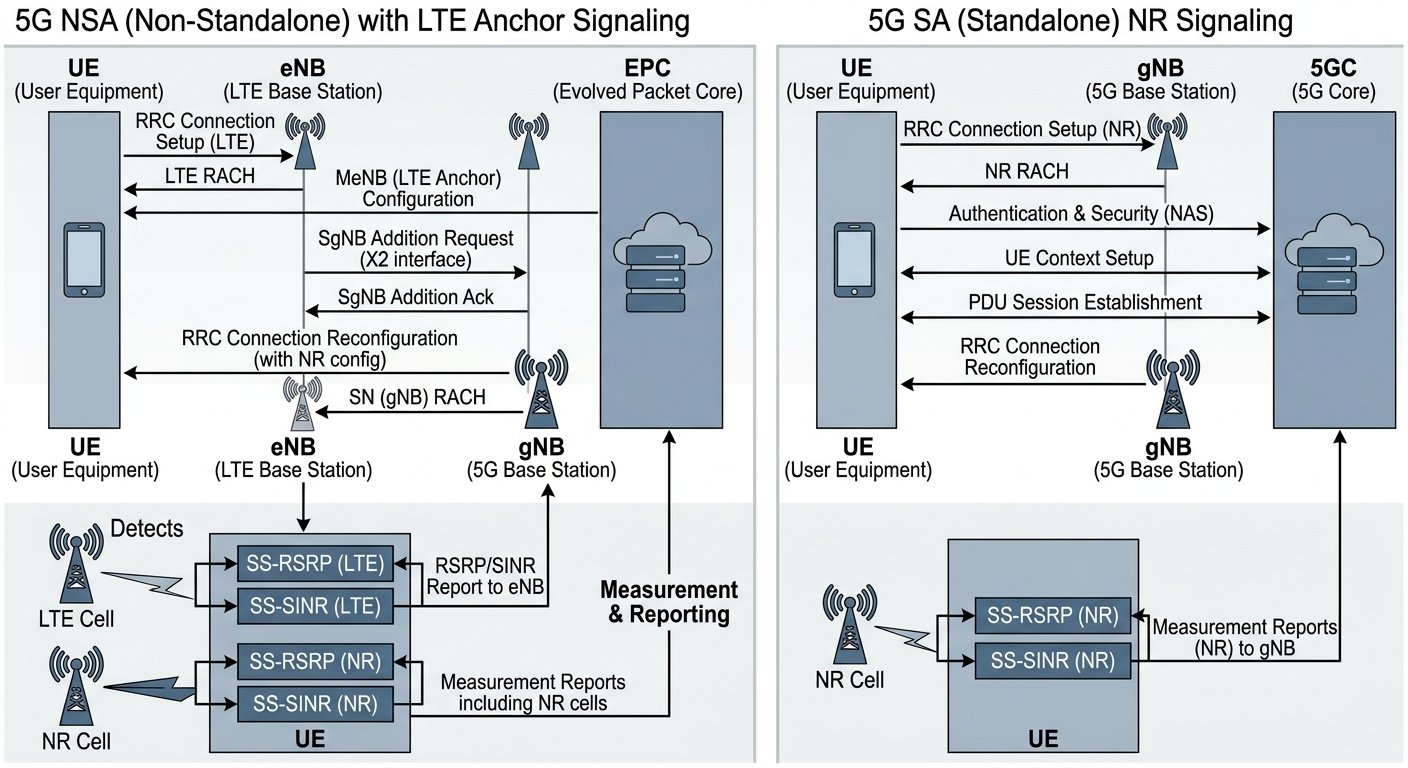
Don’t start adjusting downtilts or neighbor lists on a hunch. Run this sequence first to confirm what’s actually happening:
Running this manually across dozens of sites gets tedious fast. Dingli’s Autonomous Measurement solution monitors and validates network performance, and Dingli’s network testing data analysis and post-processing solutions turn this kind of multi-KPI correlation into a repeatable step rather than a one-off investigation.

Once the diagnostic workflow has isolated the mechanism, the fix matches the cause, not a generic power bump:
None of these should be assumed to work from a single before/after reading. Dingli’s indoor cellular coverage tester solutions, used across malls, hospitals, offices, residences, schools, and underground parking lots, along with post processing and benchmarking software, make it practical to validate a fix with a repeat measurement pass rather than taking it on faith.
Treat every RSRP-high, SINR-low reading as a trigger for structured investigation, not an anomaly to shrug off. Teams that only check RSRP heat maps during acceptance testing routinely miss pilot pollution and overshooting cells until users start complaining about dropped calls and slow data, long after the site has gone live.
The practical fix is building PCI, SINR, throughput, and handover correlation into routine drive test and indoor measurement routines, not just spot-checking RSRP. Automated and post-processing tools make it feasible to flag these mismatches across large datasets instead of relying on manual review of individual logs.
That shift matters most during the acceptance phase, when a site is still cheap to fix. Once a cell is live and carrying traffic, re-tuning azimuth or downtilt to resolve overlap means touching a network users already depend on, which is a far more disruptive conversation with operations.
As a rough engineering guide, SINR above roughly 20 dB is excellent with near-peak throughput, 13-20 dB is good, 0-13 dB is fair with visible throughput degradation, and below 0 dB is poor with likely call or session instability. These are illustrative bands, not guaranteed thresholds for every chipset.
RSRP typically ranges from about -50 dBm near the site to -110/-120 dBm at the cell edge, with -80 to -90 dBm often considered solidly usable coverage. But a good RSRP number only confirms coverage exists, it says nothing about whether SINR, and therefore achievable throughput, is also healthy.
Low SINR with strong RSRP is usually caused by pilot pollution, an overshooting neighbor cell, PCI mod-3 reuse conflicts, uplink noise from external RF sources, or dense small-cell overlap. Each has a different diagnostic signature visible in drive test logs correlating RSRP, SINR, and PCI.
Values from about -50 dBm to -90 dBm are generally considered good to usable, while readings below -100 dBm approach cell-edge conditions. Remember that RSRP alone never confirms usable link quality; always check it alongside SINR before drawing conclusions about network performance.


If you are interested in our services or need customized solutions, please feel free to contact us
Contact UsComplete the form below to have a sales person address your business needs.

